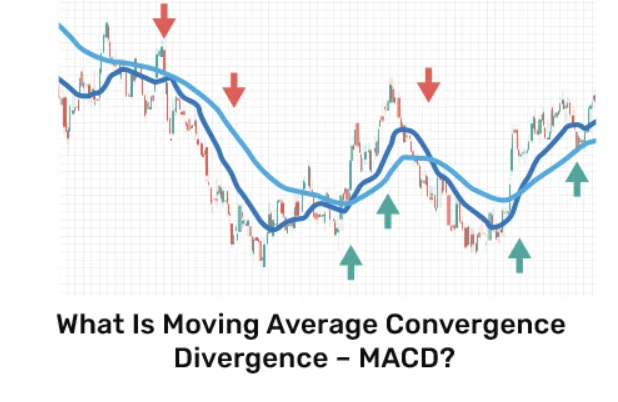
TL;DR: Unpacking What is Moving Average Convergence Divergence (MACD)
- MACD Explained: A vital technical analysis tool that tracks the relationship between two moving averages of a security’s prices.
- Signal Generation: Creates buy or sell signals through the MACD line, signal line crossovers, and divergences.
- Histogram Insight: The MACD histogram provides a visual representation of the difference between the MACD line and its signal line, indicating market momentum.
- Adjusting Settings: Traders can tweak MACD settings to align with specific market conditions or trading styles, enhancing its adaptability.
- Combining Indicators: For more robust analysis, MACD is often paired with other indicators like the Relative Strength Index (RSI) to confirm signals and gauge market conditions.
- Beware of Limitations: Recognizing that MACD is a lagging indicator can help traders avoid reliance on false signals, particularly in volatile or trendless markets.
- Strategic Application: Effective use involves confirming MACD signals with additional market analysis, considering the broader market context, and integrating it within a comprehensive trading strategy.
- Ongoing Learning: Continuous education in MACD and technical analysis broadens understanding, aids in mastering its application, and enhances trading decision-making.
Introduction to MACD
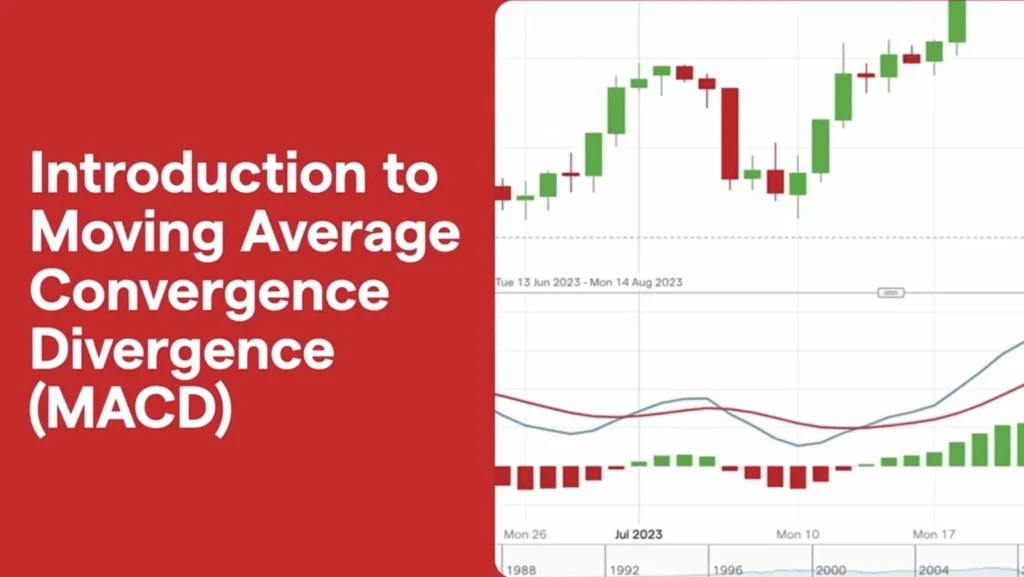
The Moving Average Convergence Divergence, or MACD, stands as a cornerstone in the realm of technical analysis.
It’s not just any indicator; it’s a reflection of a security’s momentum, capturing the essence of trends through its unique calculation of moving averages.
Definition and Origin
MACD emerged from the inventive mind of Gerald Appel in the late 1970s.
It operates on a simple yet profound principle: subtracting the 26-period exponential moving average (EMA) from the 12-period EMA.
This calculation births the MACD line, a dynamic reflection of the relationship between two pivotal moving averages of a security’s price.
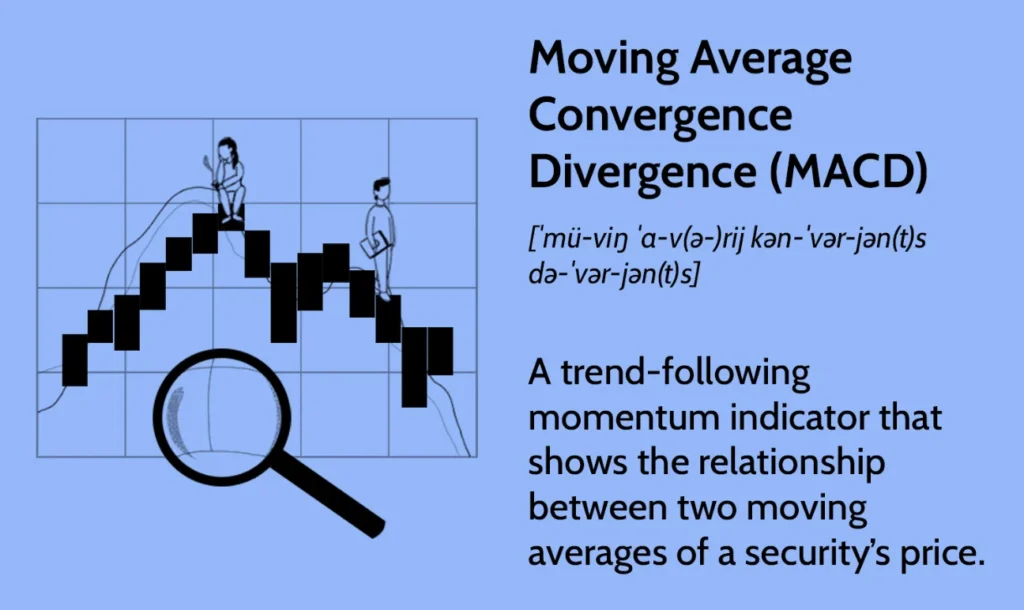
Importance in Technical Analysis
In the world of trading, MACD is a beacon, guiding traders through the market’s ebbs and flows.
It’s celebrated for its versatility, offering insights into potential buy or sell signals when the MACD line crosses its signal line.
Its prowess extends to spotting trends, gauging momentum, and even hinting at potential reversals through divergences.
Overview of the Calculation
Diving into its calculation, MACD isn’t just numbers; it’s a narrative of the market’s momentum. The crux of it lies in the difference between two exponential moving averages, specifically the 12-day and the 26-day EMAs.
Amplifying its utility is the signal line, often a nine-day EMA of the MACD line itself, offering a smoother, more nuanced view of the market’s pulse.
This trio—MACD line, signal line, and the histogram—works in concert, painting a comprehensive picture of market dynamics, and making MACD a trusted ally in the trader’s toolkit.
MUST READ: What is a Cash Frenzy in the Stock Market and How It’s Like a Casino Frenzy!
What is Moving Average Convergence Divergence: Detailed Explanation
Delving deep into the Moving Average Convergence Divergence (MACD), we uncover its mechanics and significance in the trading world.
This powerful technical indicator not only follows the trend but also gauges the momentum, offering a dual advantage in market analysis.
The Formula of MACD
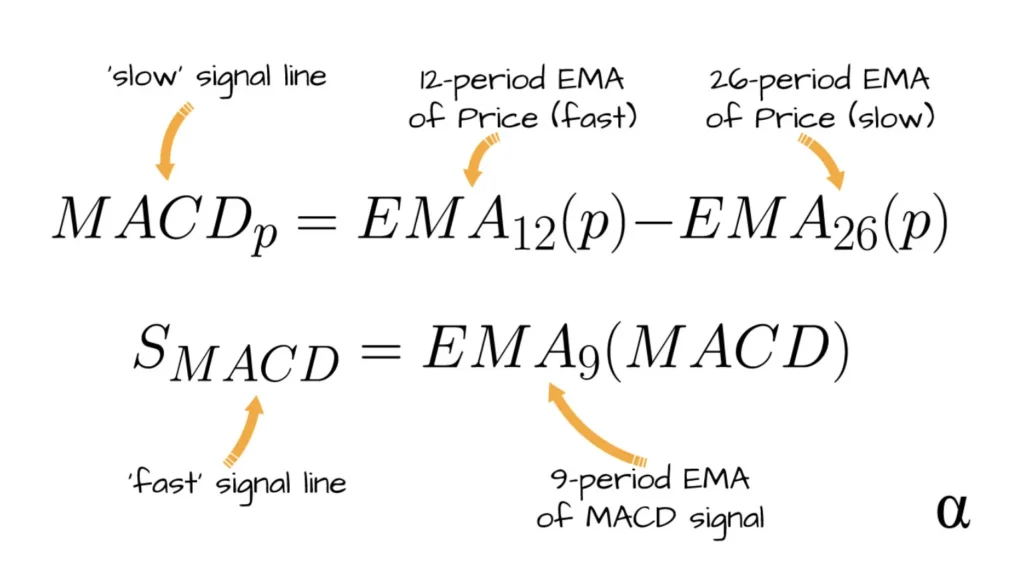
MACD thrives on simplicity and efficiency.
Its core formula, MACD = 12-Period EMA – 26-Period EMA, unveils the dynamics of market trends.
By deducting the 26-period exponential moving average (EMA) from the 12-period EMA, traders get the MACD line, a beacon indicating the market’s momentum direction.
Components: MACD Line, Signal Line, and Histogram
- MACD Line: This is the heart of the MACD, offering a fast-paced reflection of market trends.
- Signal Line: Calculated as the nine-period EMA of the MACD line, it’s the smoother counterpart, providing trade signals when crossed by the MACD line.
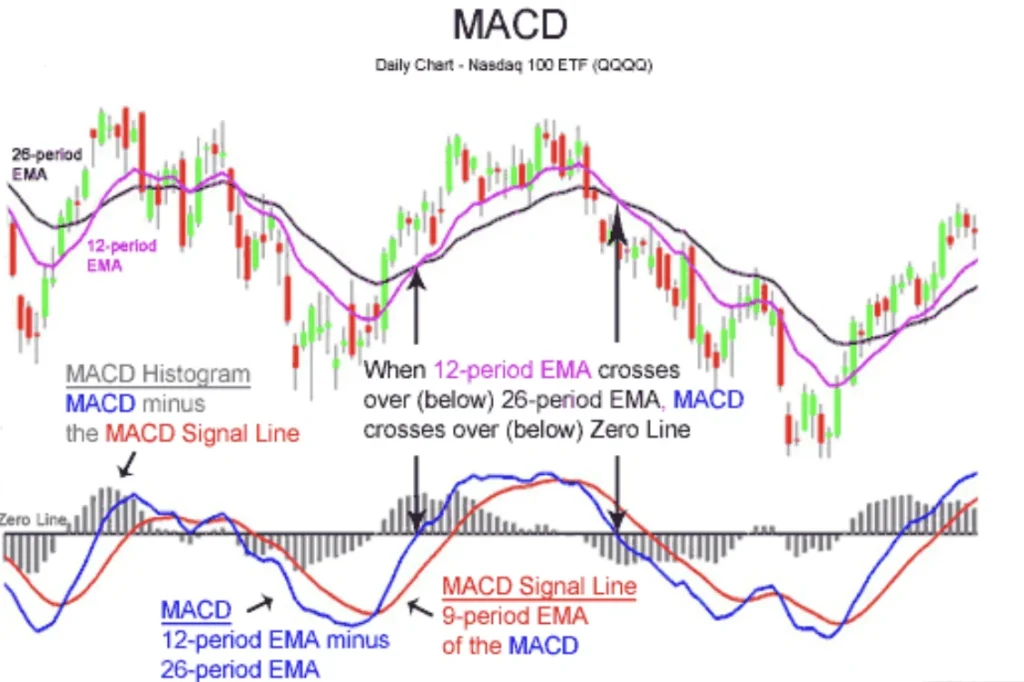
- Histogram: Visualizing the gap between the MACD line and the signal line, the histogram is a bar chart that amplifies the divergence or convergence of the two lines, hinting at potential market shifts.
Visual Representation in Charts
The real power of MACD shines in its graphical representation, where it manifests as two intertwining lines capped with a histogram.
This visual setup not only makes it easier to spot crossovers and divergences but also beautifully encapsulates the market’s pulse, guiding traders through the intricacies of buy and sell signals.
Calculating MACD
Understanding how to calculate the MACD is crucial for utilizing this powerful tool in market analysis.
The calculation centers around the relationship between two moving averages, translating their convergence and divergence into meaningful data that helps predict market momentum and direction.
The Mathematical Approach
The MACD calculation is straightforward yet profound. It subtracts the 26-period exponential moving average (EMA) from the 12-period EMA, producing the MACD line.
This line represents the heart of the MACD, offering insights into the market’s momentum by reflecting the differences between two key moving averages.
Example of Calculation Step-by-Step
- Calculate the 12-period EMA of the security’s price.
- Calculate the 26-period EMA of the same price.
- Subtract the 26-period EMA from the 12-period EMA to get the MACD line.
- Generate the Signal Line: Calculate the 9-period EMA of the MACD line itself.
- MACD Histogram: Subtract the signal line from the MACD line to get the histogram value.
This step-by-step process underscores the MACD’s responsiveness to price changes, offering traders timely signals for potential market movements.
Tools and Software for MACD Calculation
In today’s digital trading environment, numerous tools and software simplify the MACD calculation:
- Trading Platforms: Most online trading platforms include built-in MACD indicators.
- Charting Software: Specialized charting software often offers more detailed MACD analysis with customization options.
- Financial Websites: Many financial analytics websites provide MACD charts for various securities.
- Spreadsheet Programs: Traders can use formulas in programs like Excel to calculate MACD manually if desired.
These tools allow traders to efficiently use the MACD, focusing on strategy and interpretation rather than manual calculation.
Interpreting MACD signals is crucial for traders looking to understand market momentum and make informed decisions.
This section dives into how the MACD’s various components can be used to anticipate market movements, identify potential trends, and make strategic trading choices.
Understanding Signal Line Crossovers
Signal line crossovers are a fundamental aspect of using the MACD. Here’s how they work:
- Bullish Signal: When the MACD line crosses above the signal line, it suggests an upward momentum, and traders might consider buying.
- Bearish Signal: Conversely, if the MACD line crosses below the signal line, it indicates downward momentum, prompting a potential sell.
These crossovers can signal the start of new trends and are often used by traders to confirm their market predictions.
Significance of Centerline Crossovers
Centerline crossovers are another vital component of MACD analysis:
- Above Zero: When the MACD line moves above zero, it indicates a bullish market environment, suggesting the short-term average is above the long-term average.
- Below Zero: If the MACD line is below zero, it’s considered bearish, indicating the short-term average is below the long-term average.
This zero-line crossover helps traders discern between potential bullish or bearish market phases.
MACD Divergences and Their Implications
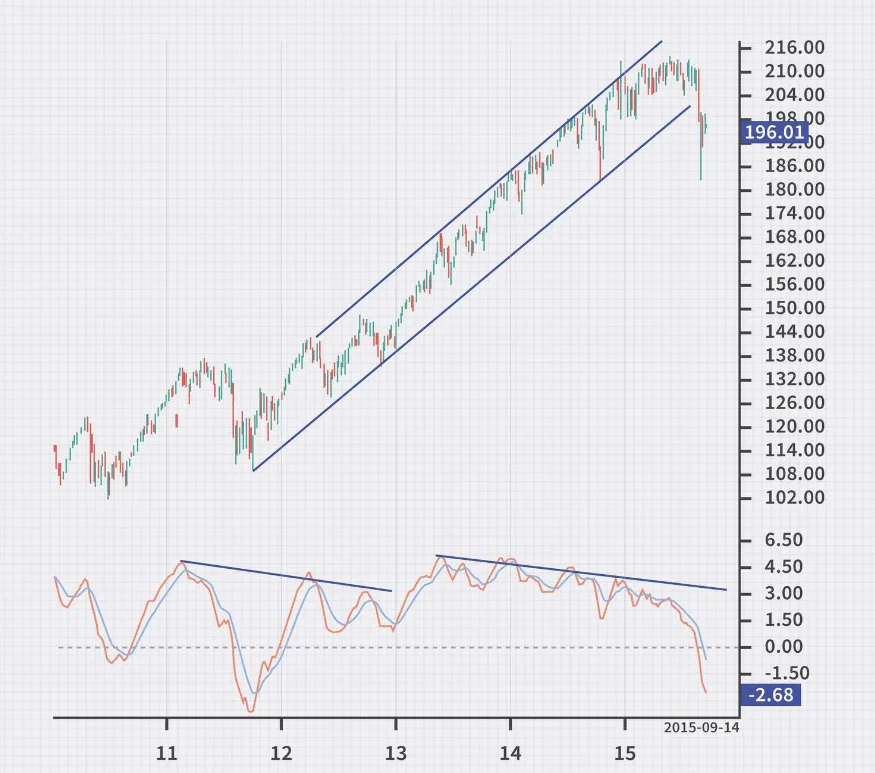
MACD divergences occur when the MACD indicator does not confirm the price action, indicating potential trend reversals:
- Bullish Divergence: This occurs when the price records a lower low, but the MACD forms a higher low. This scenario suggests a weakening downward momentum and a potential bullish reversal.
- Bearish Divergence: When the price hits a higher high but the MACD registers a lower high, it signals reduced upward momentum, possibly leading to a bearish shift.
Divergences can be key indicators of underlying strength or weakness in the market, often preceding a change in price direction.
For a more comprehensive analysis, traders often pair the MACD with other indicators, such as the Relative Vigor Index, to confirm signals and refine their trading strategy. This combination allows for a more robust market analysis, helping to confirm the signals provided by MACD and potentially increasing the reliability of the predictive insights it offers.
Practical Applications of MACD in Trading
Exploring the practical applications of the MACD in trading reveals how this versatile indicator can be a powerhouse in a trader’s toolkit.
It’s not just about spotting trends; it’s about making informed decisions based on the nuanced signals MACD provides, which can significantly enhance trading strategies and outcomes.
Strategies for Bullish and Bearish Signals
MACD is a beacon for traders, guiding them through the market’s ups and downs. Here’s how:
- Bullish Signals: When the MACD line crosses above the signal line, it’s a green flag, suggesting it might be time to buy. This is considered a bullish crossover, indicating potential upward momentum.
- Bearish Signals: Conversely, a bearish crossover occurs when the MACD line dips below the signal line, hinting that it might be time to sell or short, as downward momentum could be on the horizon.
Traders leverage these signals to time their entry and exit points, maximizing potential profits and minimizing risks.
Combining MACD with Other Indicators
While MACD is powerful, it shines brightest when paired with other indicators:
- Integrating MACD with indicators like the Relative Strength Index (RSI) or Bollinger Bands provides a more comprehensive view, allowing traders to confirm signals and avoid potential false positives.
- Such combinations can help delineate clearer buy or sell signals, refine risk management, and provide a deeper understanding of market sentiment.
This synergistic approach can amplify the effectiveness of a trader’s strategy, offering a more rounded and informed analytical perspective.
Advanced Concepts and Strategies
Diving into the advanced concepts and strategies of the MACD enriches a trader’s toolkit, offering nuanced insights into market behaviors.
This exploration is key for those looking to deepen their market analysis and refine their trading strategies using the MACD’s full potential.
MACD Histogram and Market Sentiment
The MACD histogram serves as a refined tool, capturing the momentum and speed of price changes. It reflects the intensity of market sentiment by illustrating the difference between the MACD line and its signal line.
A rising histogram indicates increasing bullish sentiment, while a falling histogram suggests growing bearish tendencies.
This immediate feedback on market sentiment helps traders anticipate potential price moves based on the momentum’s strength.
Adjusting MACD Settings for Different Markets
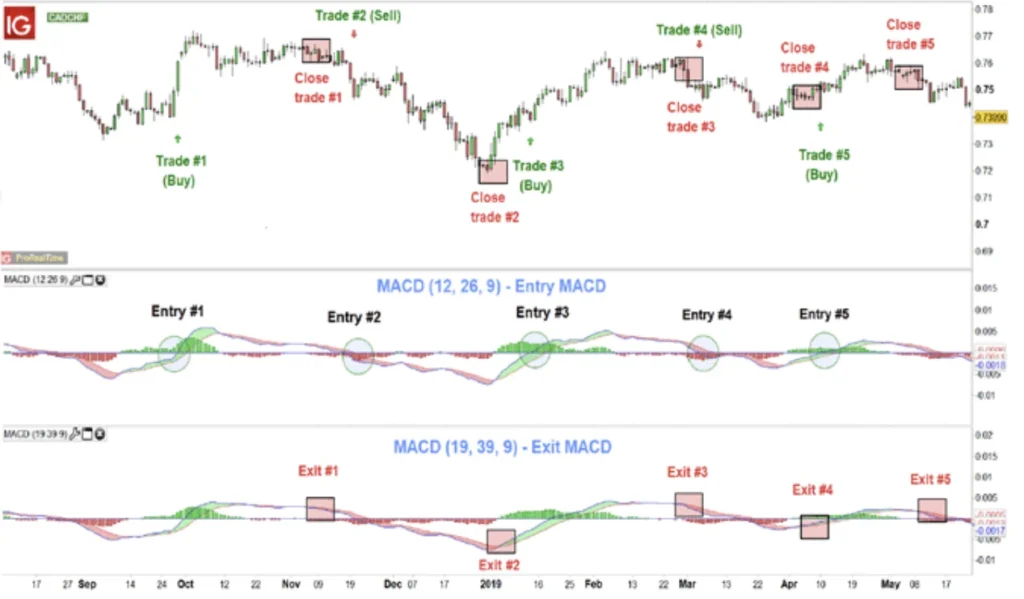
Tailoring the MACD settings to suit different markets is a strategic approach to enhance its effectiveness. Traders often adjust the time periods of the moving averages to make the indicator more responsive or to filter out market noise.
A faster MACD can be achieved by reducing the period lengths, making it more sensitive to price movements, which is ideal for shorter time frames or more volatile markets.
Conversely, increasing the periods smooths out the MACD line, offering clearer signals in less volatile environments or for longer-term trend analysis.
Combining MACD with RSI for Enhanced Analysis
Merging the MACD with the Relative Strength Index (RSI) creates a powerful analytical duo that offers a dual-layered scrutiny of the market.
This combination allows traders to validate their signals, where congruence between MACD crossovers and RSI’s position relative to its thresholds (typically 30 and 70) can reinforce trade decisions.
This strategic alliance helps in identifying robust trends and potential reversal points, providing a more comprehensive view of the market’s momentum and possible overbought or oversold conditions.
Limitations and Considerations
Grasping the limitations and considerations of the MACD indicator is essential for traders aiming to harness its full potential while being mindful of its constraints.
This awareness can significantly enhance the effectiveness of trading strategies, ensuring that the MACD is applied judiciously within the broader spectrum of market analysis tools.
Potential Pitfalls and Common Misinterpretations
- Lagging Nature: MACD, based on historical data, may provide signals that lag current market events, potentially leading to delayed entry or exit points.
- False Signals: Especially in volatile markets, MACD can generate false signals, misleading traders about the actual market direction.
- Overreliance: Solely depending on MACD for trading decisions can result in oversight of critical market context or other important indicators.
- Misinterpretation: Incorrectly interpreting the MACD histogram or signal crossovers can lead to contrary trading actions, such as buying in a downtrend or selling in an uptrend.
How to Avoid False Signals
Avoiding false signals from the MACD necessitates a disciplined approach to market analysis.
Traders are advised to corroborate MACD indications with other technical tools or market data to substantiate the predicted trend or momentum.
Ensuring that the MACD’s readings align with the broader market context and the asset’s fundamental conditions can further safeguard against deceptive signals.
Additionally, adopting a patient stance to wait for the market to provide supplementary confirmation of the MACD’s signals can help in mitigating premature trading actions based on potentially faulty indications.
Complementary Indicators to Use with MACD
Enhancing the MACD’s utility involves integrating it with other technical indicators to form a comprehensive trading framework:
- The Relative Strength Index (RSI) is frequently paired with the MACD to confirm momentum and ascertain overbought or oversold states.
- Utilizing Moving Averages helps to determine the prevailing market trend, which can validate the trade signals suggested by the MACD.
- Bollinger Bands provides insights into price volatility and normative price ranges, offering a contextual backdrop for the MACD’s trend-following signals.
By considering these aspects and combining the MACD with other reliable indicators, traders can cultivate a more robust analytical toolkit, thereby refining their trading decisions and enhancing their overall market strategy.
Conclusion
Wrapping up our exploration of the MACD indicator, it’s clear that while it is a powerful tool in the trader’s arsenal, its effectiveness hinges on a nuanced understanding of its functions, proper application, and integration with broader trading strategies.
Reflecting on the MACD’s utility, we acknowledge its strengths in trend analysis and momentum signaling, alongside recognizing the need for continued learning and adaptation in its application.
Recap of Key Points
- MACD is a trend-following momentum indicator that illustrates the relationship between two exponential moving averages.
- It offers signals through crossovers, divergences, and the MACD histogram, each providing insights into market momentum and potential price changes.
- Despite its utility, the MACD is not foolproof and can generate false signals, particularly in volatile or sideways markets.
- Effective use of MACD involves corroborating its signals with other technical indicators and a thorough analysis of market conditions.
Final Thoughts on the Effectiveness of MACD
The MACD stands out as a versatile indicator, adept at capturing market trends and momentum.
However, its effectiveness is not absolute; it excels in trending markets but may falter in range-bound situations.
Traders benefit most from MACD when they understand its underlying mechanics, recognize its signals’ implications, and apply it within the context of a comprehensive trading plan.
Acknowledging its limitations as a lagging indicator is also crucial, ensuring traders remain alert to the nuances of market behavior and the potential for signal discrepancies.
Continuing Education on MACD and Technical Analysis
For traders keen on maximizing the potential of MACD, continuous education is indispensable.
Delving deeper into technical analysis, understanding the intricacies of market dynamics, and staying updated with new trading methodologies can enhance the effectiveness of MACD.
Exploring advanced topics, such as combining MACD with other technical tools or adapting its settings to align with personal trading styles, can provide additional layers of insight and strategy refinement.
Ultimately, the journey to mastering MACD is ongoing, with each trading scenario offering a new opportunity to learn, adapt, and grow as a market participant.
