TL;DR: Key Takeaways on What Is Relative Vigor Index
- Essence of RVI: The Relative Vigor Index (RVI) is a technical analysis tool that measures the strength of a trend by comparing closing prices to opening prices.
- Signal Interpretation: Traders use the RVI to spot potential bullish or bearish trends through crossovers of the RVI line and its signal line.
- Trading Strategies: Incorporate RVI into trading strategies to identify overbought or oversold conditions, anticipate market reversals, and confirm trend strength.
- Combining Indicators: Enhance RVI’s effectiveness by pairing it with moving averages or other oscillators to confirm signals and refine trading decisions.
- Practical Applications: Apply RVI in forex trading, stock market analysis, or CFD trading to gain insights into market momentum and make informed trading moves.
- RVI Divergences: Watch for divergences between RVI readings and price action as they can indicate potential reversals or continuation of trends.
- Versatility in Markets: Use RVI across various financial markets on trading platforms like MetaTrader 5, ensuring adaptability in different trading environments.
- RVI Adjustments: Adjust the RVI settings according to your trading style and the specific market conditions to optimize its performance and reliability.
Table of Contents
Introduction to Relative Vigor Index (RVI)
Definition and Origin of RVI
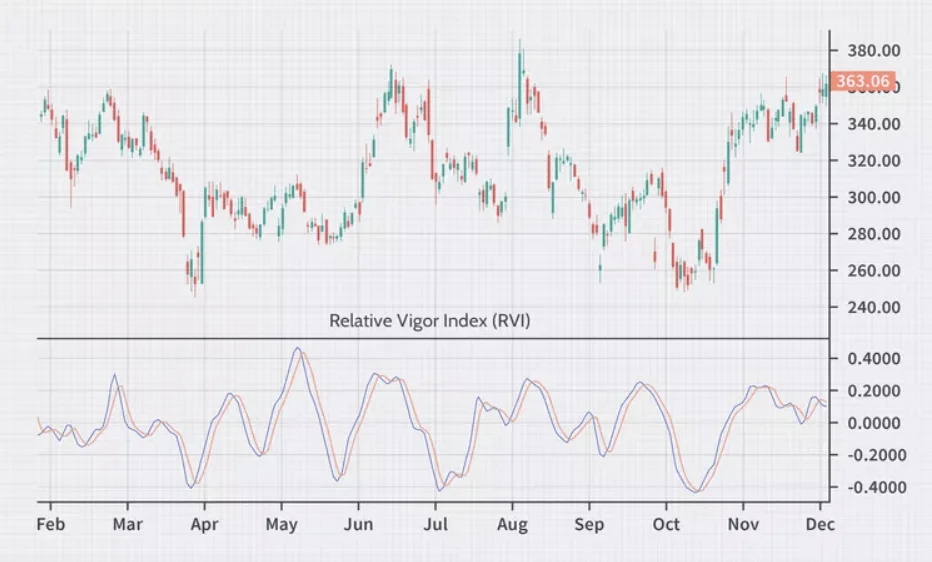
The Relative Vigor Index (RVI) is a technical indicator that measures the strength of a trend by comparing the closing price of a security to its price range, smoothing the results with a simple moving average.
The RVI stands out because it focuses on the tendency of prices to finish stronger than they started in uptrends and weaker in downtrends.
Its creation aimed to provide a more nuanced understanding of the market’s momentum compared to traditional indicators.
The Importance of RVI in Market Analysis
RVI plays a crucial role in market analysis by offering unique insights into the market’s energy or vigor.
It’s particularly valued for its ability to predict shifts in market trends through its divergence and crossover signals.
By comparing the closing and opening prices, RVI helps traders gauge the ongoing strength of a trend, allowing them to make more informed decisions, especially in conjunction with other technical tools.
Overview of Momentum Oscillators in Trading
Momentum oscillators, like the RVI, are vital tools in trading, providing clear signals about market conditions.
They oscillate around a central point or line, indicating overbought or oversold conditions and potential reversal points.
Unlike bounded oscillators, RVI’s centered approach offers a unique perspective, focusing on the closing vs. opening prices, thereby enabling traders to assess the market’s momentum with a different lens compared to indicators like RSI or MACD.
What Is Relative Vigor Index – In-Depth Exploration
Diving deep into “What is Relative Vigor Index (RVI)” reveals its unique standing in the realm of technical indicators. This exploration unfolds the mathematical intricacies, offers a clear guide on its calculation, and juxtaposes the RVI with famed oscillators, providing a panoramic view of its analytical prowess in the forex and stock markets.
The Mathematical Formula Behind RVI
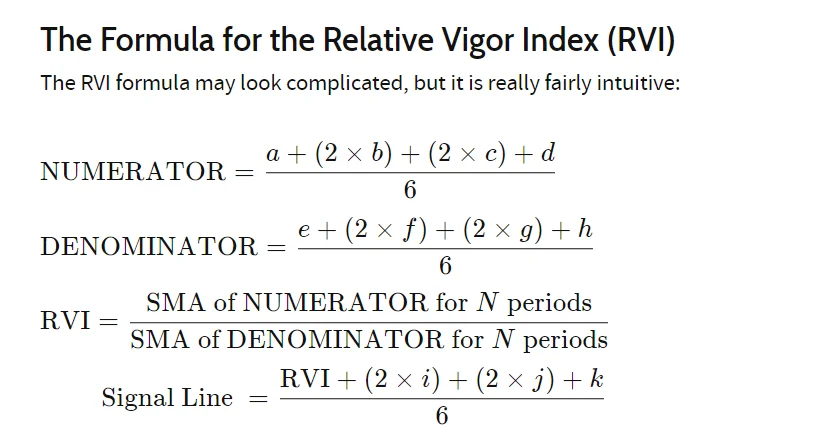
The RVI’s foundation is a formula that balances simplicity with insightful depth.
It employs a numerator and a denominator where the numerator is a sum of closing price differences over a set period, and the denominator is the sum of range differences.
The formula expresses the RVI as a ratio of these two, aiming to capture the trend’s vigor by focusing on how prices close relative to their opening.
RVI Calculation: Step-by-Step Guide
- Select the Period (N): Decide on the number of periods (N) you want to examine (commonly 10).
- Calculate the Numerator: Sum the differences between closing and opening prices for the period, adjusted by a factor of 2 for all but the first term.
- Compute the Denominator: Sum the ranges (high minus low) for the same bars, similarly adjusted.
- Smooth the Results: Calculate a simple moving average (SMA) for both the numerator and denominator over the N period.
- Divide and Plot: Divide the smoothed numerator by the smoothed denominator to get the RVI and plot it against the centerline to interpret the strength of the trend.
Comparing RVI with Other Oscillators like MACD and RSI
The RVI stands out by focusing on the close versus the open, unlike the MACD which considers the relationship between two EMAs, or the RSI which evaluates price changes about recent price highs and lows.
While MACD and RSI are renowned for their trend-following capabilities, RVI specializes in capturing the market’s enthusiasm, making it a unique tool for predicting trend continuity and spotting reversals through its distinctive divergence and crossover signals.
How to Interpret the Relative Vigor Index
Interpreting the Relative Vigor Index (RVI) transforms raw data into actionable trading insights, guiding traders through the nuances of market momentum and trend strength.
This segment illuminates how to decode RVI readings, its central benchmark’s importance, and its pivotal role in signaling market dynamics.
Understanding RVI Readings and Signals
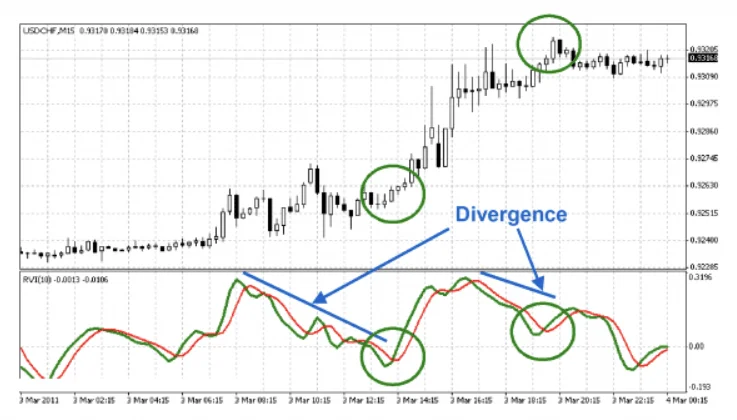
The RVI zeroes in on the closing price’s relation to the range, offering a snapshot of market sentiment. A rising RVI suggests bullish momentum, indicating that prices are closing near the high of their range.
Conversely, a falling RVI points to bearish trends, with prices closing near their low.
Traders watch for RVI crossovers with its signal line, as these can herald upcoming changes in trend direction, providing crucial buy or sell prompts.
The Significance of RVI’s Centerline
The RVI revolves around a centerline, usually set at zero, acting as a neutral point that helps distinguish between bullish and bearish market conditions.
When the RVI is above this line, it suggests that the market’s momentum is strong and possibly escalating. If it’s below, it may signal weakening momentum or a potential downtrend.
This centerline is essential for interpreting the RVI’s inclination and adjusting trading strategies accordingly.
RVI’s Role in Identifying Market Momentum
RVI’s forte lies in its capacity to gauge the strength behind price movements, offering a lens into the market’s underlying momentum.
By focusing on how strongly an asset closes within its daily range, RVI provides a nuanced view of market energy, aiding traders in spotting both the continuation of current trends and potential reversal points.
Its utility shines in trending markets where it can signal whether the trend is likely to sustain or exhaust itself.
The mastery of RVI interpretation is crucial for traders aiming to leverage this momentum indicator’s insights for crafting well-timed, informed trading decisions in the forex and stock markets.
Practical Applications of RVI in Trading Strategies
Leveraging the Relative Vigor Index (RVI) in trading strategies equips traders with powerful insights into market conditions, offering predictive cues and enhancing decision-making.
This exploration delves into how RVI identifies overbought and oversold territories, utilizes divergences for forecasting reversals, and synergizes with other indicators to fortify trading signals.
Trading Overbought and Oversold Conditions with RVI
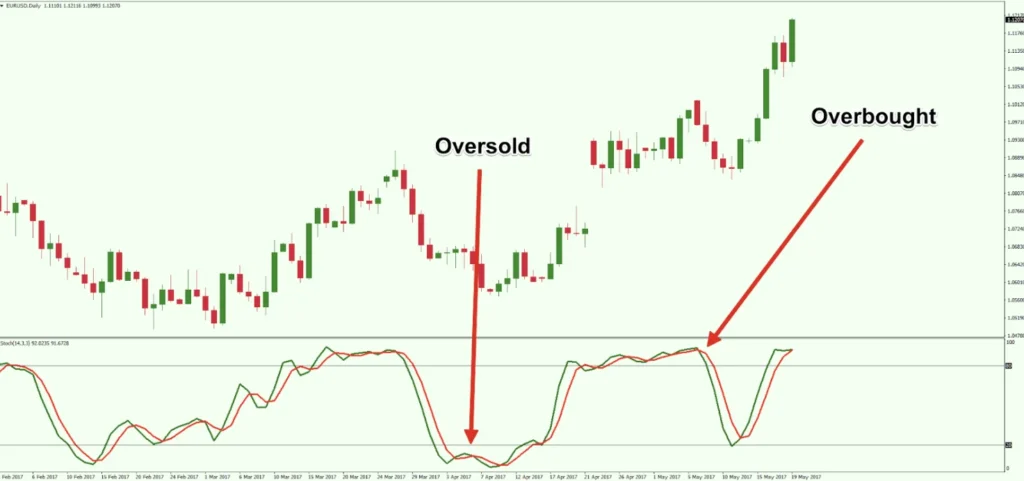
The RVI shines by highlighting overbought or oversold states, pivotal for timing the market. When RVI peaks and begins to turn, it might signal an overbought condition, suggesting a potential sell-off.
Conversely, if RVI dips and starts to rise, it might indicate an oversold market, hinting at an upcoming price increase. Traders use these insights to refine entry and exit points, maximizing potential gains while minimizing risks.
The Power of Divergences: Predicting Market Reversals
Divergences between the RVI and price action are critical signals, often preceding market reversals.
A bullish divergence, where the price hits a new low but RVI does not, can foretell a potential upward trend.
Conversely, a bearish divergence, with the price at a new high but RVI lagging, may signal an impending downward shift. These divergences are vital clues that guide traders to anticipate and react effectively to probable trend reversals.
Combining RVI with Other Technical Indicators for Enhanced Signals
Integrating RVI with other technical indicators like the Relative Strength Index (RSI) or Moving Average Convergence Divergence (MACD) can create a robust analytical framework, offering a multi-dimensional view of the market.
This combination can validate trade signals, enhance trend analysis, and provide a clearer understanding of market dynamics.
By cross-referencing RVI signals with other indicators, traders can better predict market movements and tailor their trading strategies accordingly.
Understanding the practical applications of RVI allows traders to harness its full potential, blending it seamlessly into their trading strategies for informed decision-making and optimized market engagement.
Advanced RVI Indicator Strategies
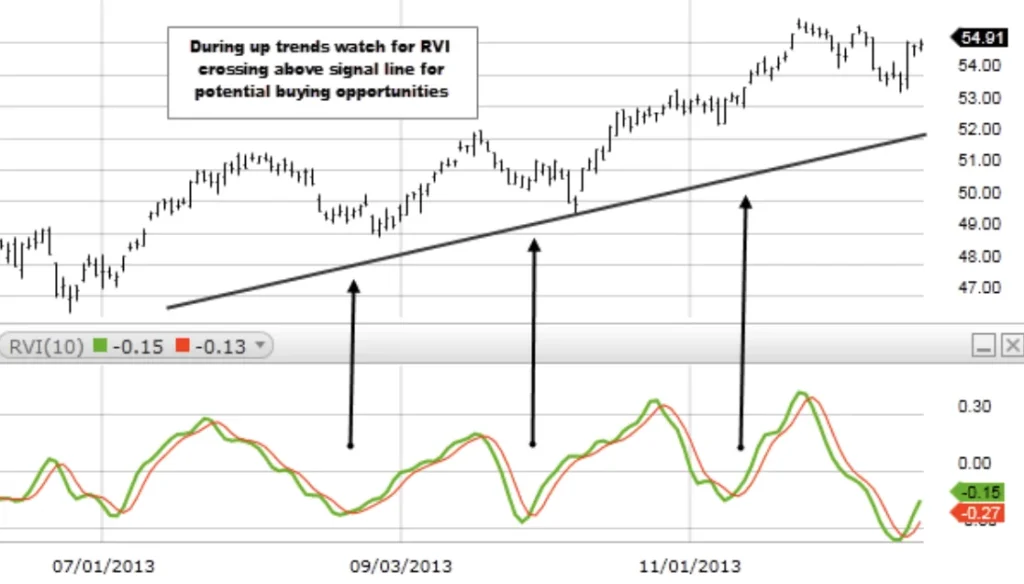
Exploring advanced strategies with the Relative Vigor Index (RVI) unveils its capacity to refine trading approaches, offering sophisticated methods to utilize this versatile indicator.
This exploration covers the strategic integration of RVI with moving averages, its combination with other oscillators for enhanced trading insights, and practical examples from successful trading setups, showcasing the RVI’s adaptability and strength in diverse market scenarios.
RVI and Its Confluence with Moving Averages
- Enhancing Trend Confirmation: Using RVI alongside moving averages can confirm trend strength. When RVI’s direction aligns with the moving average, it signals a robust trend.
- Signal Refinement: A moving average can act as a filter for RVI signals, where trades are only considered if the RVI crossover occurs in the direction of the prevailing moving average trend.
- Dynamic Support and Resistance: Moving averages can serve as dynamic levels of support or resistance, with the RVI providing additional insight into the market’s momentum at these critical points.
Synergizing RVI with Other Oscillators for Optimal Trading
- Complementary Signals: Pairing RVI with oscillators like MACD or RSI can offer complementary signals, helping to confirm potential buy or sell opportunities indicated by RVI.
- Divergence Detection: Utilizing RVI in conjunction with other oscillators enhances the ability to spot divergences, a key indicator of potential trend reversals or continuations.
- Risk Management: The combination allows for a multi-layered approach to risk assessment, ensuring that traders are not relying solely on one indicator’s signal.
Case Studies: Successful Trading Setups Using RVI
- Bullish Breakout Example:
- Scenario: RVI crosses above its signal line while the price action breaks above a significant resistance level.
- Outcome: The subsequent uptrend confirms the RVI’s bullish signal, leading to profitable long positions.
- Bearish Reversal Instance:
- Scenario: A high RVI reading coincides with a price reaching a new high, followed by a bearish divergence with the RVI declining.
- Outcome: The price action reverses, validating the RVI’s warning of overextended bullish momentum.
- Consolidation Exit Cue:
- Scenario: RVI remains flat while the market enters a consolidation phase, suggesting a lack of trend strength.
- Outcome: The trader exits the position to avoid the uncertainty of a ranging market, as indicated by the stagnant RVI.
These advanced strategies demonstrate the RVI’s utility in crafting nuanced trading strategies, offering traders a comprehensive toolkit for market analysis and decision-making in forex, CFDs, and other financial markets.
key points to remember about using the Relative Vigor Index (RVI)
- RVI is a momentum indicator comparing closing prices to trading range, essential for assessing trend strength.
- Look for RVI crossing its signal line; above signals potential buys, below indicates sells.
- Enhance trading strategies by pairing RVI with moving averages or oscillators like MACD or RSI.
- Divergences between RVI and price action are crucial; they often signal upcoming trend reversals.
- Use RVI to identify overbought or oversold conditions, aiding in optimal entry and exit decisions.
- Incorporate RVI in your technical analysis toolkit on platforms like MetaTrader 5 to enrich forex or CFD trading.
- Always double-check RVI signals with other indicators to minimize false signals and improve accuracy.
- Remember, no indicator is foolproof; use RVI alongside comprehensive market analysis to inform your trading decisions.
Understanding these points ensures a solid foundation for integrating the Relative Vigor Index into your trading practices, enhancing your ability to navigate forex markets and seize trading opportunities effectively.
Frequently Asked Questions About Relative Vigor Index
How Does RVI Compare to Other Popular Indicators?
RVI offers a distinct approach by focusing on the relationship between closing and opening prices, which helps in understanding trend vigor. Unlike RSI or MACD, which measure price changes or momentum differently, RVI provides insights specifically about the trend’s closing strength relative to its opening.
Can RVI Be Used for All Trading Instruments?
Absolutely, RVI is adaptable and effective across various trading instruments, including forex, stocks, and commodities. It’s versatile, providing key insights into the market’s momentum and potential shifts in trends regardless of the trading environment.
Is RVI a good indicator?
RVI is a robust indicator for those who understand its nuances. It excels in revealing the strength and sustainability of trends by comparing closing prices to opening prices, making it valuable for informed trading decisions when combined with other analysis tools.
What is the difference between RSI and RVI?
RSI evaluates the speed and change of price movements, often highlighting overbought or oversold conditions. In contrast, RVI focuses on closing price strength relative to opening prices, offering a unique perspective on the market’s momentum and potential turning points.
What does RVI measure?
RVI specifically measures the vigor or energy of a market trend by analyzing the closing prices against the opening prices over a specified period. It aims to gauge the conviction of market participants and the likelihood of continued trend direction.
How do you trade with RVI indicator?
Utilize the RVI indicator by looking for crossovers with its signal line to identify potential bullish or bearish trends. Enhance its effectiveness by combining it with other technical analysis tools, ensuring that the signals are corroborated and more reliable for making trading decisions.
What is the range of the RVI indicator?
The RVI indicator doesn’t confine itself to a fixed range like some oscillators. It fluctuates around a centerline, with values above indicating bullish momentum and values below signaling bearish conditions, thus providing a dynamic gauge of market sentiment and trend strength.
