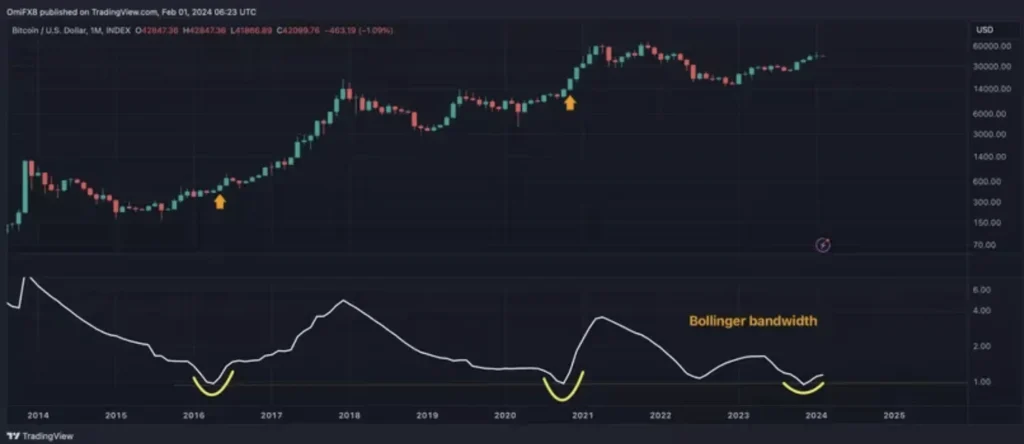
In the ever-turbulent sea of cryptocurrency, a beacon has once again begun to shine, potentially guiding Bitcoin traders toward the next big wave of opportunity. The spotlight turns to an old, yet reliable indicator: the Bollinger Bands, particularly the Bollinger bandwidth on Bitcoin’s monthly chart. This indicator, a brainchild of the renowned analyst John Bollinger from the 1980s, has shown a pattern eerily reminiscent of the prelude to Bitcoin’s most dramatic rallies in 2016 and late 2020. But what does this mean for traders and investors today?
A Glimpse into the Past to Predict the Future
Just over three months ago, the crypto world buzzed with anticipation as the Bollinger bandwidth, based on Bitcoin’s weekly price changes, hinted at a volatility explosion. This prediction materialized just before the U.S. welcomed the debut of spot BTC ETFs, marking a significant moment in Bitcoin’s journey. Now, with the monthly chart’s bandwidth mirroring patterns seen before monumental price surges, the question on everyone’s mind is: Are we on the cusp of another Bitcoin bonanza?
“Since inception, 1% has been a major low for bitcoin’s monthly chart Bollinger bandwidth, with subsequent upturns coinciding with prolonged price rallies or bouts of upside volatility.”
Coindesk
Decoding the Bollinger Bands
To understand the significance of this pattern, let’s break down the Bollinger Bands. This tool consists of three bands:
- The middle band represents the 20-period simple moving average of the asset’s price.
- The upper and lower bands stand two standard deviations away from the middle, above and below, respectively.

The magic lies in the Bollinger bandwidth, the spread between the upper and lower bands, measured as a percentage of the moving average. A narrow bandwidth is akin to a coiled spring, hinting at a potential major price move. Recently, this bandwidth bounced from the critical 1% mark, a historical precursor to significant market movements.
What’s Next for Bitcoin?
While the current bandwidth pattern stirs memories of past bull runs, it’s crucial to remember that it signals the likelihood of a major price move without specifying the direction. Despite this, the mood among analysts is predominantly bullish, fueled by the optimism that the recently launched spot ETFs will further propel Bitcoin’s adoption and price.
“Most analysts are bullish on the cryptocurrency, expecting the recently launched spot ETFs to accelerate adoption and lift prices to new record highs above $69,000 in the next 12 months.”
A Word of Caution
As we navigate these promising yet uncertain waters, it’s important to heed the lessons of history: past performance is not always indicative of future results. The cryptocurrency market is known for its volatility, and while the signs point towards a bullish trend, the possibility of a downturn cannot be entirely ruled out.


